Intro
As Daily grows, and our customers grow along with us, our goal is to provide the best possible developer experience. In short, this means giving you the tools you need to accelerate your time to market, and to do so without sacrificing user experience for your customers. One of the most requested features we get is the ability to understand call quality. In service of this, we are rolling out a series of features that will allow anyone building with Daily to better understand what’s happening on any call and for any participant.
We are striving to provide a better level of insight into the specifics of every call, so that you can focus on building your applications, but also dig into the details whenever it is necessary.
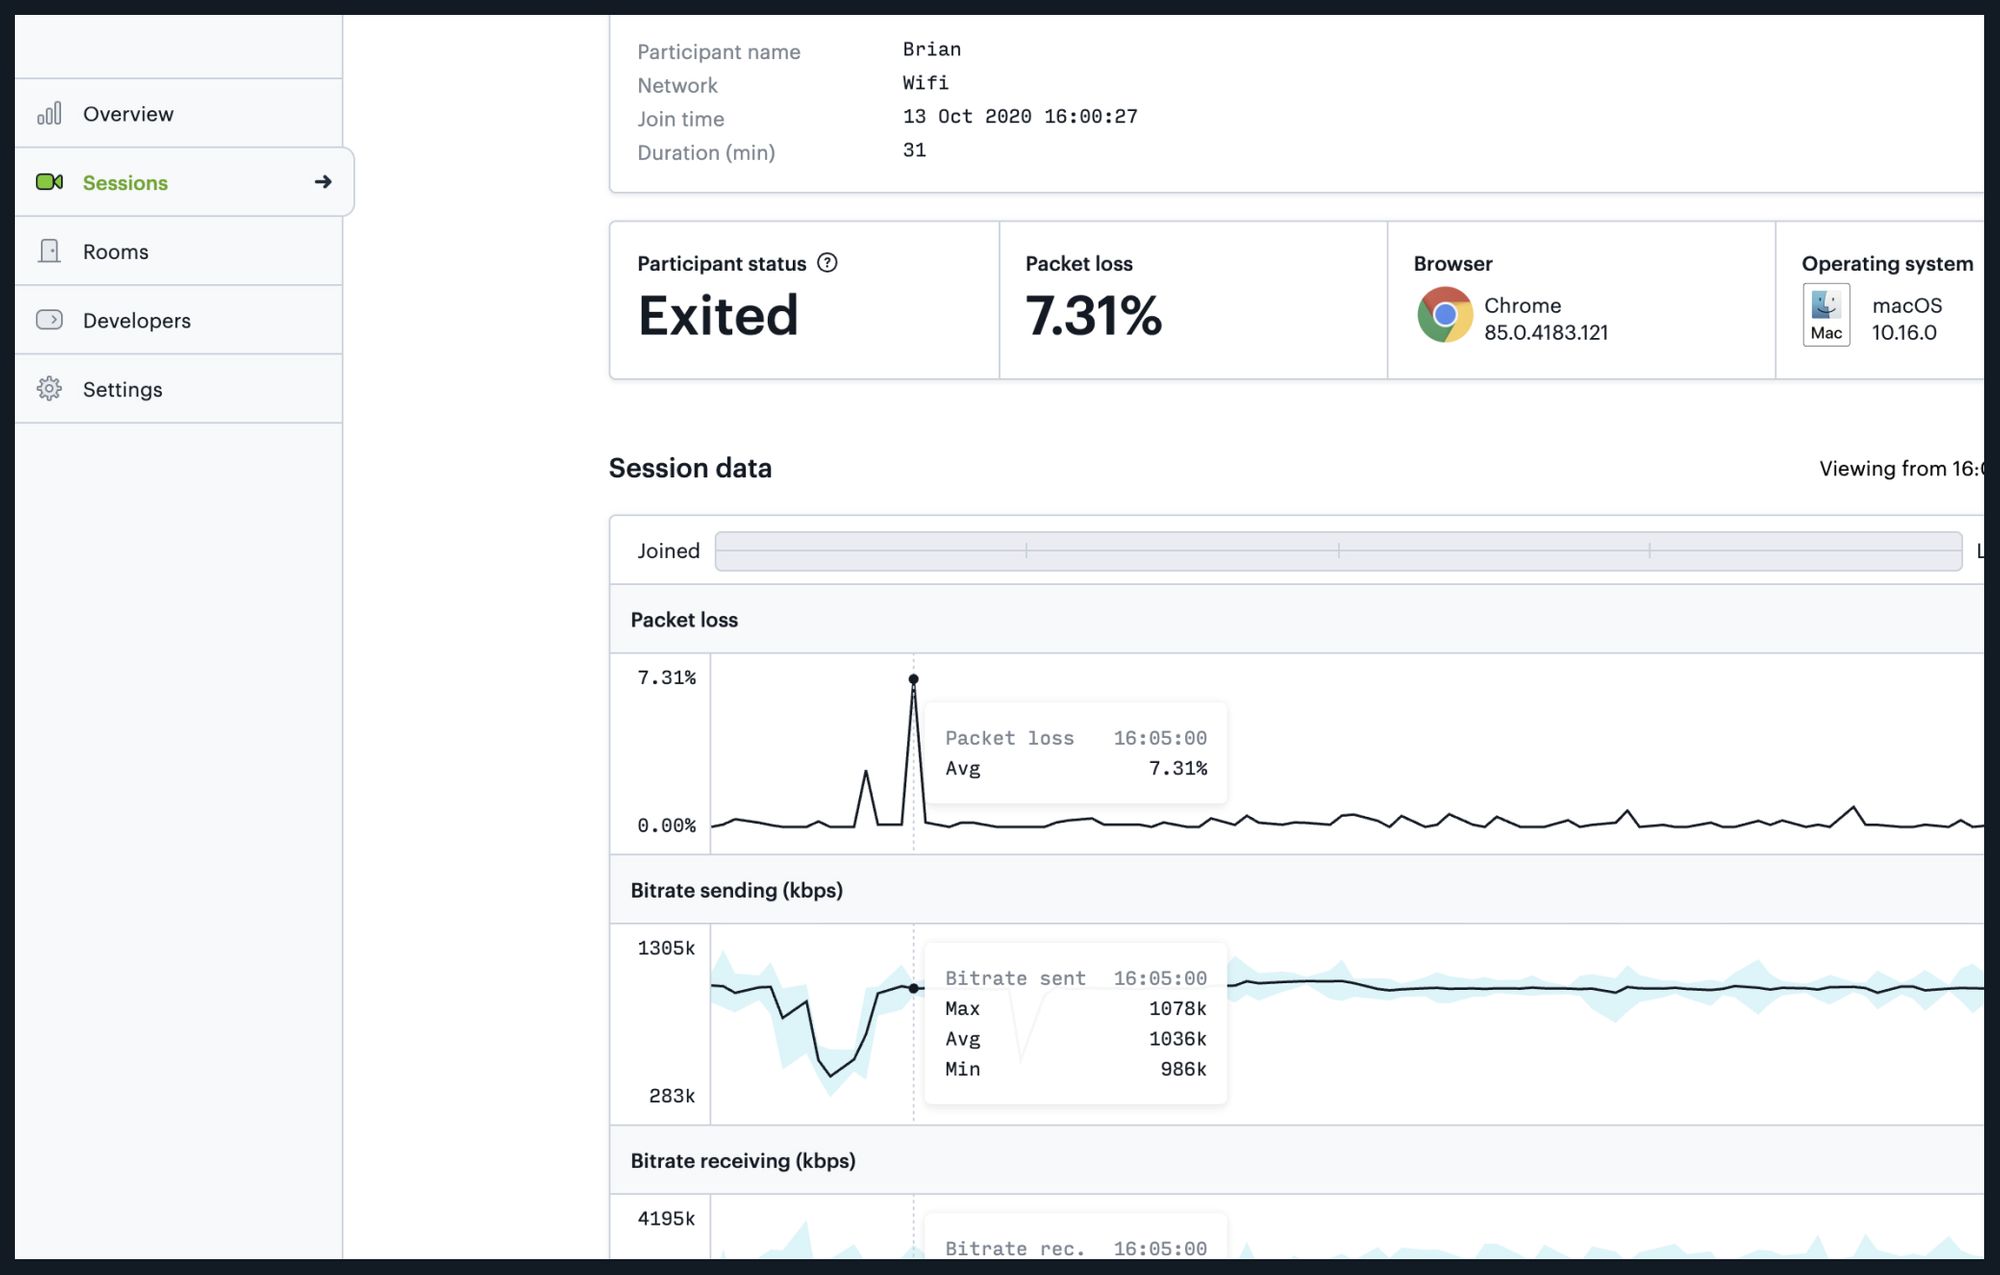
For those that read our Changelog or regularly use our dashboard, you may have noticed we launched a new Sessions tab recently. This was just the first step in a series of meeting insights features. Starting today, you can also see per-participant metrics and call logs.
Let’s take a closer at both sessions and participant views.
Sessions
The Daily Dashboard provides access to both past and live sessions through the Sessions tab.
This overview provides you with the following:
- Session ID
- Room name
- Participant count (historical max)
- Duration
- Start time (UTC)
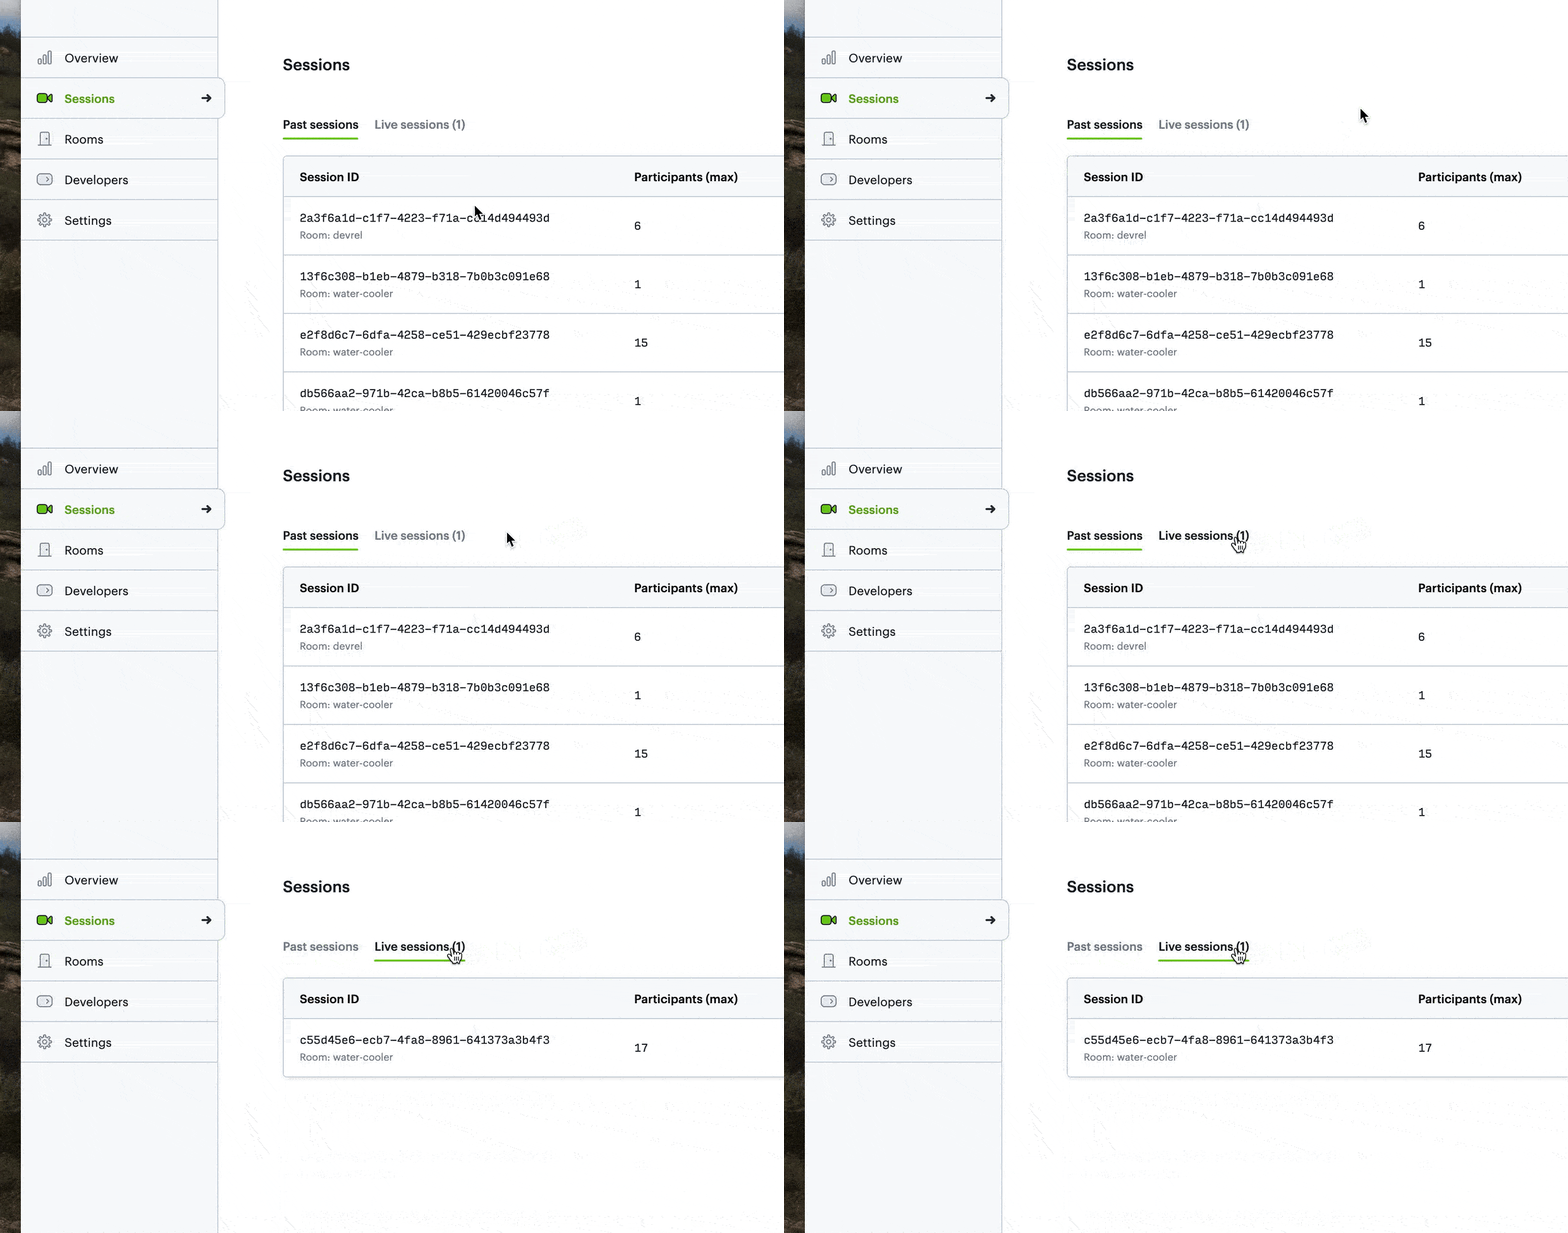
When you click on a session, you can see specifics about a call, including a list of participants that joined the call.
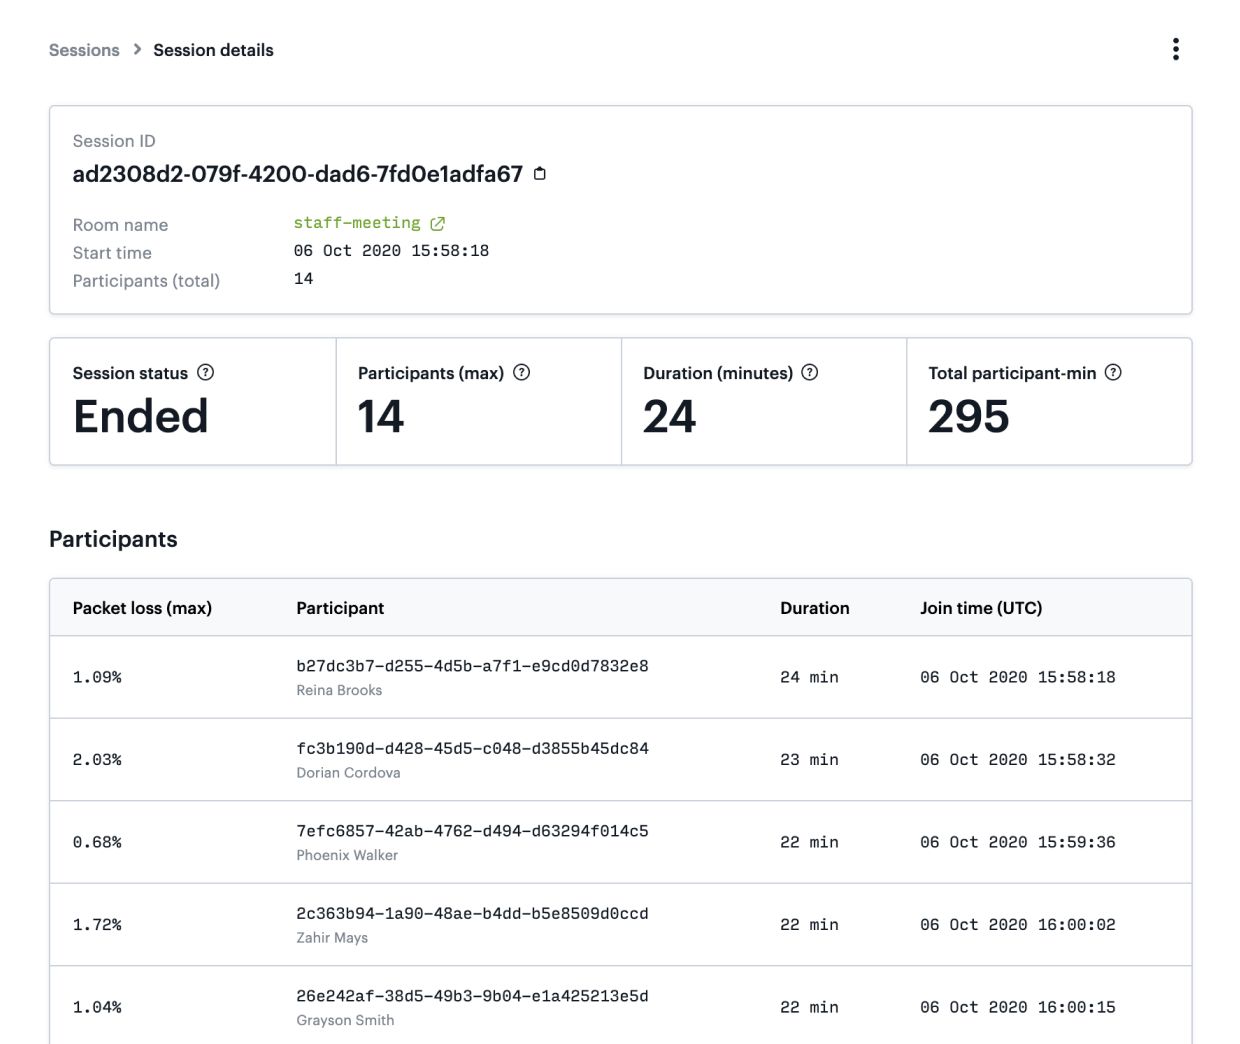
Clicking through to the session details, you see the same overview data from the previous page. Additionally, you are presented with session status, and the total number of participant-minutes used.
Below that you will see a table of individual participants which includes:
- Packet loss (max %)
- Participant ID (and name)
- Duration
- Join time (UTC)
This provides an excellent way to get a rough idea of how each participant experienced their session.
Note: If a user leaves and rejoins a meeting, they will be given a new participant ID and therefore show up as two separate participants.
Participant
Digging further into the available data, let’s look at the new participant details.
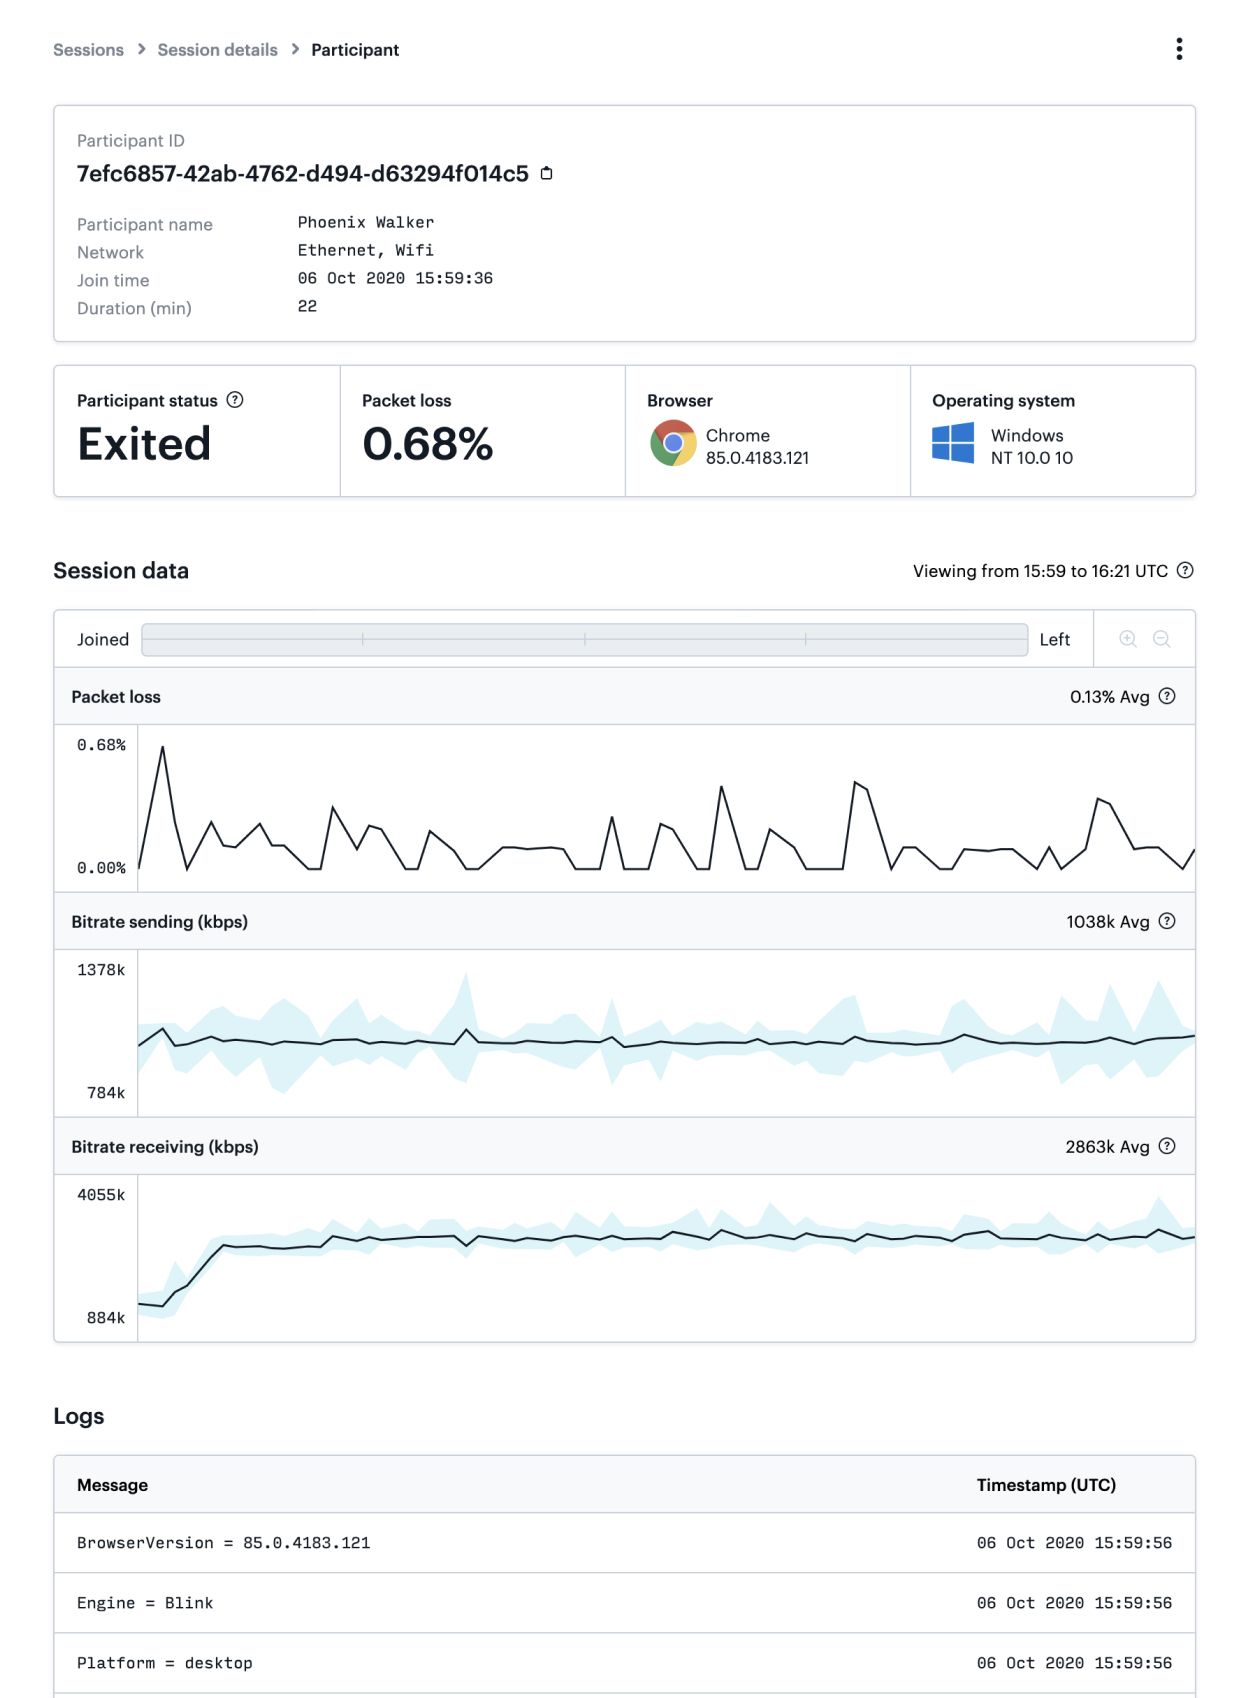
You will three distinct sections:
First, an overview, which includes
- Participant ID
- Name
- Network
- Join time
- Duration
- Status
- Packet loss
- Browser
- OS
Second, once the session is complete, three graphs:
- Packet loss
- Bitrate (sending)
- Bitrate (receiving)
You can use the controls above this section to zoom in and look at these in greater detail.
Finally, you will see a complete set of call logs, which include a message and a UTC timestamp. We will cover these in greater detail in future posts.
Search
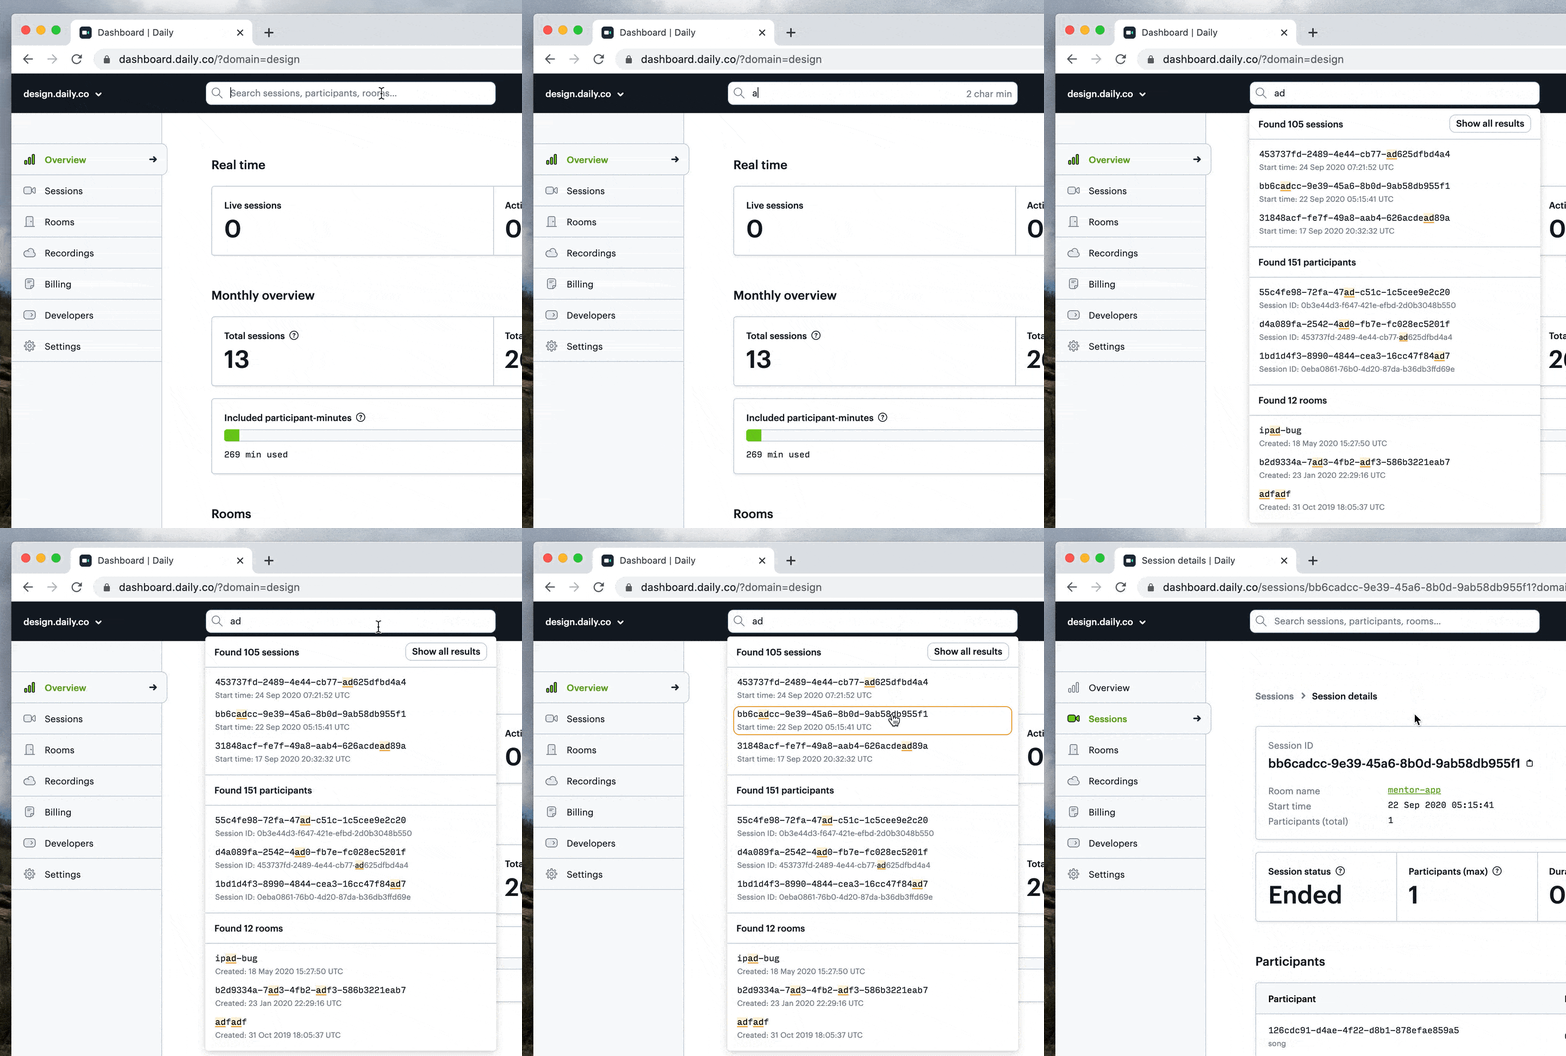
Now that you have access to all this data, wouldn’t it be great if there was an easy way to find it? Well there is! You can now search by:
- Session
- Participant
- Room
Data retention
The retention period for data is based on your Daily plan:
Free: 1 day
Launch: 3 days
Scale: 21 days
Custom options for enterprise plans
What’s next?
As you can see the team has been busy building our data ingestion infrastructure and finding the best possible ways to present it via the dashboard. This allows for easier debugging and more granular insight into meeting and participant experience.
In addition to all the dashboard features outlined above, we are also providing REST API access to this data via a new /logs endpoint. This will allow you to ingest this data into the tools of your choice. We also have a new visualization tool that builds on this endpoint to show the power of what is possible with this data.
